Solutions to a Challenging Decade on Wall Street
The 1970s marked an especially difficult economic
period in the U.S. A devastating bear market from 1973-1974, exacerbated by the Watergate scandal, the Nixon resignation, and the oil embargo, led to a 45% loss on the Dow Jones Industrial
Average—the worst seen since the Great Depression. With Wall Street marred by negativity and skepticism, the DJIA gained a dismal 5% from 1970 to 1979.

Throughout the
highs and lows of the 1960s stock market, William O'Neil and Company further refined its trading methodology by studying every stock from 1952 to 1971 that posted a greater than 100% gain within one
year. This allowed us to reaffirm previous stock selection patterns and identify more key indicators for stocks setting up to move higher. We collected our findings in The Model Book of Greatest Stock
Winners in 1971, the first of an ongoing series of studies.
Proof That Market Timing Works
The 1973-1974 bear market threatened many brokerage houses with bankruptcy. In February 1973, O'Neil turned bearish before most other brokerage firms, and in October 1974, we accurately identified the recession recovery. Using market timing rules based on historical precedent, O'Neil came out from the 1973-1974 bear market largely unscathed. Our proven ability to navigate tough market environments gave our method—combining outperformance and capital preservation through proper stock selection and market timing—new resonance and our list of clients began to grow.
“Timing, in anything you do in life, is half the battle.”
� William J. O’Neil, from a 1975 speech

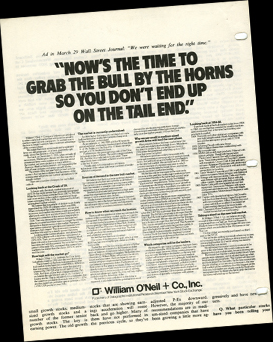
In March 1978, O'Neil ran a two-page, bullish Wall Street Journal advertisement with the headline: "Now's the Time to Grab the Bull by the Horns So You Don't End Up on the Tail End." We were effectively calling the start of a new bull market for small- to mid-sized growth stocks, and we called it right. March would be the beginning of a bull run that saw the DJIA run up 25% in six months.

The Other Half of the Story: Stock Selection
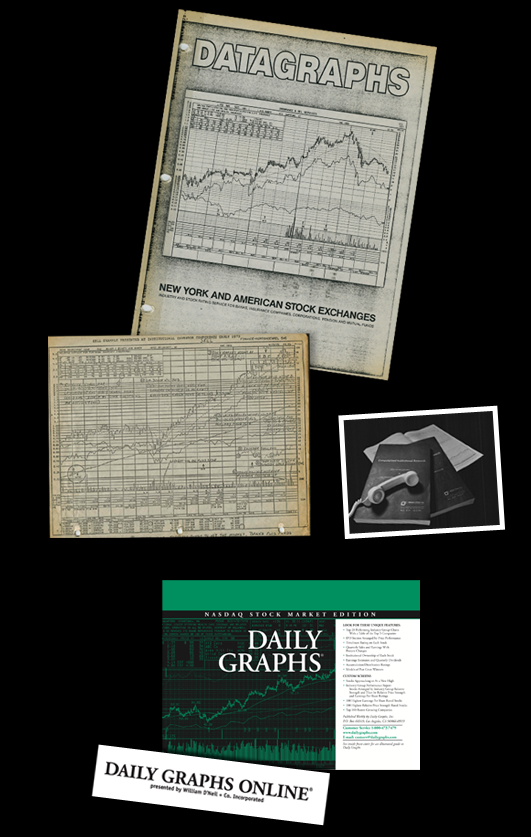
The other draw for O'Neil was our pioneering work in using computers to plot the activity of stocks, together with their fundamental data into a time-saving graph that held all of the critical information a money manager needed to assess a stock. We called these graphs "Datagraphs," and on July 2, 1970, the Datagraphs book service was launched—a weekly, six-pound, 700-page, 11 x 7-inch book of stock charts, selected by applying his proprietary ratings and rankings to his one-of-a-kind stock database. Organized by industry group, the Datagraphs book detailed more than 60 data points on 1,400 stocks. In 1972, the Datagraph format for stock charts was trademarked, and by 1979, the client base for the Datagraphs book had grown more than 30-fold.
In 1972, Daily Graphs, a weekly printed book of stock charts, was launched for the retail investment community. It provided computer-generated fundamental and technical stock information to help the serious individual investor make well-informed stock market decisions. The professional quality graphs provided key information, such as one-year of daily price and volume, relative strength, estimates, earnings, and over 20 other data points, to efficiently evaluate stocks. Daily Graphs would later become the foundation for Daily Graphs Online and eventually evolve into the highly acclaimed MarketSmith research tool. The chart books gained popularity in the investment community for their quality and comprehensiveness, and nationwide subscribership flourished.
Delivering Time-Sensitive Data Pre-Digital Age
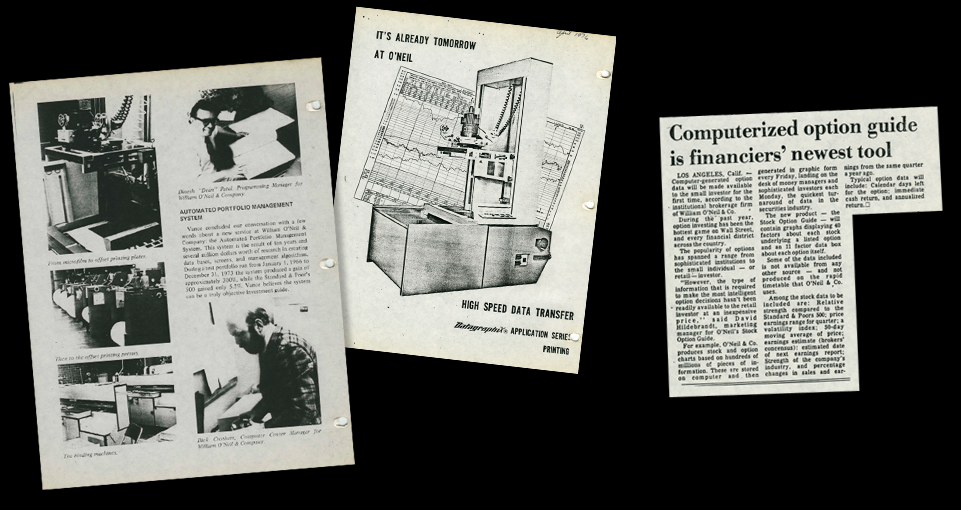
Faced with the problem of disseminating time-sensitive and actionable stock information to clients across the country in a timely way (pre-Internet and pre-FedEx), O’Neil turned to technology once again. On October 25, 1973 O’Neil Data Systems, Inc., or ODS, a 10,000–square foot printing and computer graphics production plant in Culver City, California, was launched. The plant used FR80 computer output microfilm graphic recorders, 35mm Recordak Dacomatic micro film, Stromberg DatagraphiX 7010 platemakers, and Davidson printing presses—all state-of-the-art technologies at the time—to transfer information from a Burroughs B6700 computer database in Beverly Hills. Datagraphs, the service, was printed, bound, packaged at ODS, and ready for delivery within 24 hours of Friday’s market close. By Monday morning, it was on the desk of hundreds of top U.S. money managers.

Investing for the Masses
On May 1, 1975, the Securities and Exchange Commission deregulated fixed trade commissions and the discount brokerage firm was born, opening up investing independence to the average American. In 1979, O’Neil opened the Stock Mart, a do-it-yourself, low-commission, discount brokerage firm that attracted nationwide clients by still providing a personal touch. Attached to a financial book store that housed over 3,000 titles, the Stock Mart fostered an investing community and created a vehicle for investment education, where most Saturdays an incognito “Bill” could be found sharing investing wisdom. Clients from all over flocked to pick up hot-off-the-press Daily Graph and Datagraph books, place trades, connect with like-minded investors, and grow their investing knowledge. The investment education and inspiration fostered by the Stock Mart continues today through the Meetup Groups and University offered through Investor’s Business Daily®, the newspaper O’Neil began in the 1980s.